Real-time · Per-link · Honest

Finally see what's working.

Every scan, every tap, every click — captured, organized, and explained in a dashboard you can read at a glance. Stop guessing whether your QR menu, NFC card, or campaign link actually gets used. LinkMetry shows you the real story, in real time.

Free tier covers everything you need to start measuring. Upgrade when you outgrow it.

Pairs with NFC QR

Scroll

01 / What we capture on every scan, tap, or click

The visitor doesn't notice a thing. You see everything.

The moment someone interacts with one of your links — by clicking it online, scanning a QR code, or tapping an NFC tag — LinkMetry quietly records:

  • When it happened

    To the second.

  • Where they were

    Country and city, derived from their IP address.

  • What they used

    Phone, tablet, or desktop; iOS or Android; Chrome or Safari; including version.

  • How they got there

    The source: email, social, a website, a print scan, or direct.

  • Their preferred language

    So you can spot international audiences.

  • Whether it was a real human or a bot

    Automatically flagged and filtered out by default.

All of it written to your dashboard within seconds — and the redirect is so fast the visitor goes straight to your destination as if they typed it in directly.

02 / A dashboard that finally makes sense

Open it on your phone. Get the answer in 5 seconds.

We built LinkMetry's dashboard for busy owners and marketers — not for data analysts. Within 5 seconds you can answer:

  • How many people scanned, tapped, or clicked today, this week, this month?
  • Which of my links is actually performing — and which one is dead weight?
  • Where in the world are my visitors coming from? A live world map and a ranked list of top countries and cities.
  • Are they on mobile or desktop? iPhone or Android? Chrome or Safari?
  • What channel is driving traffic — email, Instagram, in-store QRs, NFC?
  • How does this week compare to last week? Built-in period comparison, no spreadsheet needed.
Today-so-far header with clicks-over-time chart
World map with country and city ranking sidebar

Real-time, not yesterday's news.

  • Today so far

    Updates live as scans roll in.

  • Clicks-over-time charts

    Toggle between hourly and daily views.

  • Bot filter

    On by default, so the numbers you see reflect real humans — but flip it off if you want to investigate suspicious traffic.

03 / Drill into a single link

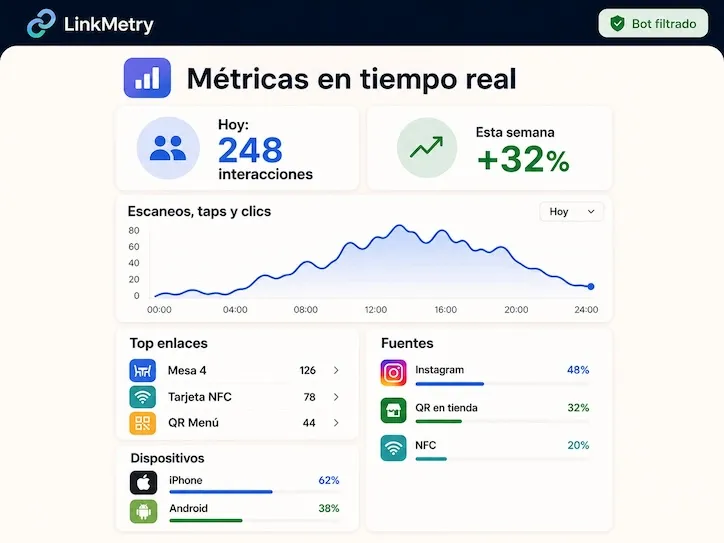
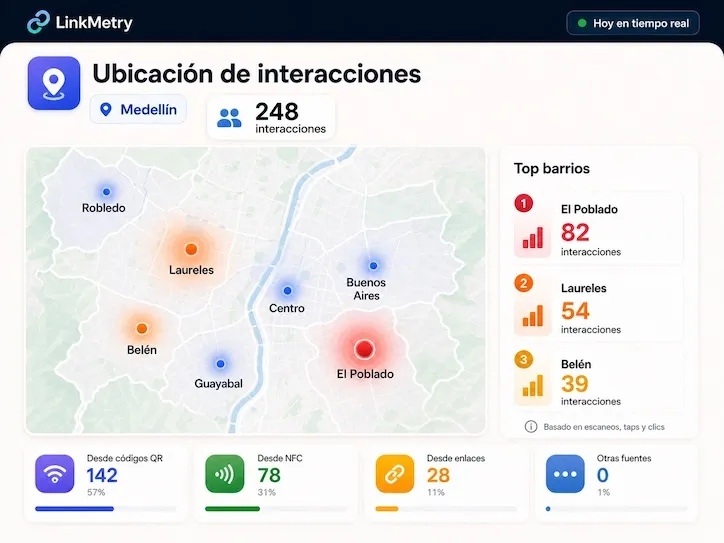
Same map, same charts — scoped to one piece of physical or digital real estate.

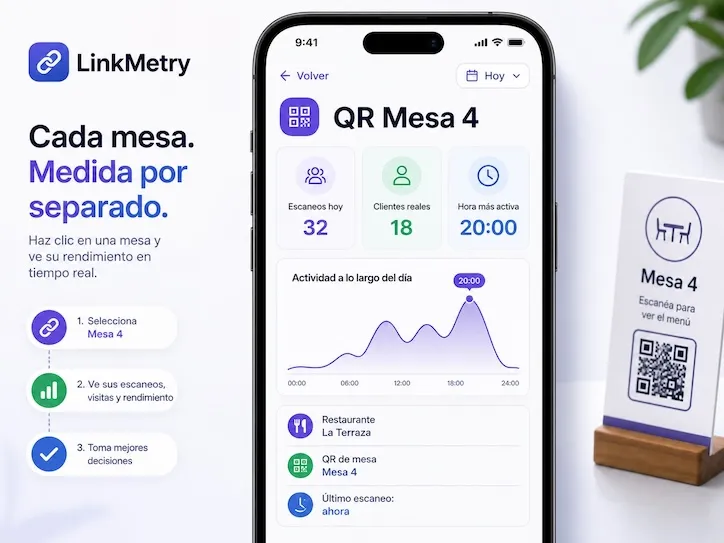
Click any link to see only its scans. This is what makes LinkMetry click for restaurants, retailers, and event organizers: you can see whether Table 4 actually gets scanned, whether your packaging in Florida is performing as well as in Texas, whether "Bartender Mike" is bringing in tips, or whether your NFC business card is being tapped at the conferences you went to.

Per-link labels — your secret weapon.

Most analytics tools drown you in unreadable URLs like xy7k2pq. LinkMetry lets you name each link — "Table 4 front", "Spring Promo Email", "Bartender Mike", "Booth A-12 Wristband" — so when you open the dashboard, every row is instantly recognizable. No more guessing which slug went where.

Single-link drilldown for 'Table 4 front'

04 / Multiple brands, one login

One account. Separate workspaces per brand.

If you run more than one business, manage clients as an agency, or operate across multiple locations, LinkMetry gives you separate workspaces under a single account. Switch between them with a dropdown — analytics, links, and QR codes stay perfectly siloed per brand.

05 / Honest, transparent tracking

Your data lives in your workspace. Not for sale.

We're upfront about exactly what we capture and we don't sell or share it. Your data lives in your workspace, accessible only to you. We tell you, in plain language, what's recorded on every link — and we make it easy to show that disclosure to your end users if your local regulations require it.

Take your data with you.

Export any date range as a clean CSV file and load it into Excel, Google Sheets, Looker, or your CRM (available on the Business plan). Your data is yours.

06 / Pricing

Start free. Upgrade when you outgrow it.

Per month, in USD. Cancel anytime. No card needed for the Free tier.

  • Free

    $0 /month

    Everything you need to start measuring.

    • Up to 50 active links
    • Branded QR generation included
    • Real-time analytics with 30-day history
    • City and country geolocation
    • Device and browser breakdowns
    • Bot filtering
    • 1 workspace
    Sign up free
  • Pro

    $15 /month

    For growing businesses with more campaigns.

    • Up to 1,000 active links
    • Full analytics history
    • Custom domain for your short links
    • Per-link labels and tags
    • Period comparison (week-over-week, month-over-month)
    • 3 workspaces
    • Email support
    Sign up free
  • Business

    $45 /month

    For agencies and multi-brand operators.

    • Unlimited active links
    • CSV export to Excel, Sheets, Looker, or CRM
    • Unlimited workspaces (one per brand or client)
    • API access
    • Priority support
    • Onboarding session
    Sign up free